Data Collection and Processing 

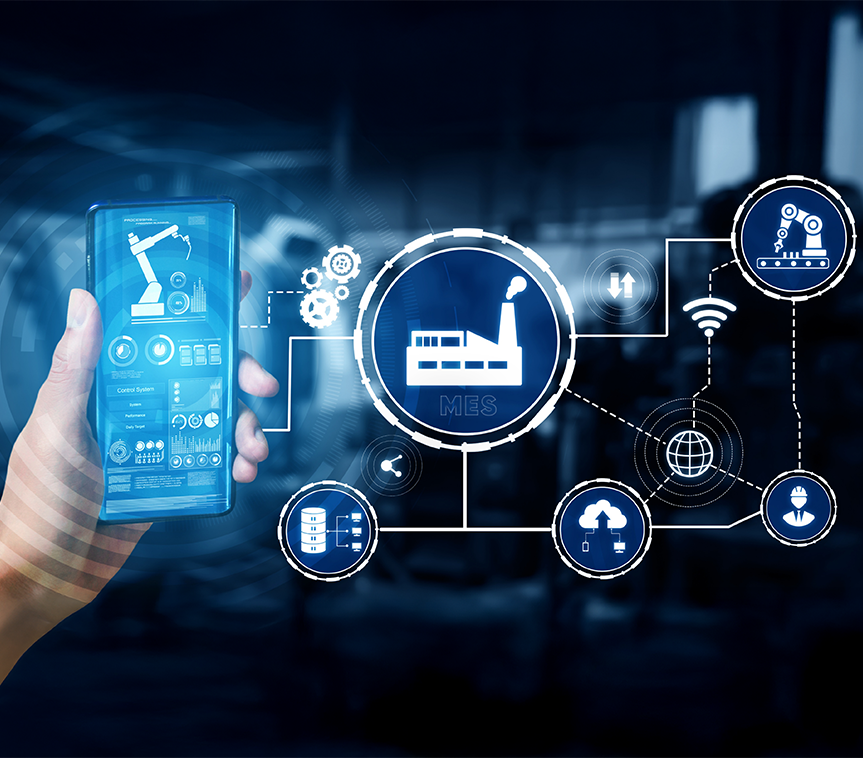
The Data Collection and Processing Module collects data from all equipment, sensors and operators in the production line in a central structure. Thanks to real-time data flow, every stage of production can be monitored digitally, and data can be analyzed without loss and safely.

The collected raw data is interpreted by the system, and production deviations are determined at an early stage with anomaly detection algorithms. In this way, both quality and efficiency increase; managers can make fast and effective decisions based on accurate data. It creates a data-based control and improvement culture in the production area.

Request a Demo

Data Collection and Processing
Data Collection and Processing Module
Production data is collected, processed and analyzed instantly from devices and operators. Anomalies are detected, performance is reported. Processes become transparent, decisions are made based on data. All data is monitored with visual panels and archived securely.
Data Collection
Data Processing
Production Monitoring
Anomaly Detection
Reporting
Data Collection

Data Collection and Source Integration

It enables data collection from machines, control systems and manual entry points on the production line and meaningful analysis of this data in a single center. Thus, the entire production process can be monitored and managed digitally.

Features

  •  Identifying Data Sources
  •  Data Protocols Adaptation
  •  Data Flow and Synchronization
  •  Data Validation

Defining Data Sources
PLC, SCADA, HMI, IoT sensors and manual input panels in the production environment are defined on the system. Connection information and data flow points for each data source are configured.

Adaptation of Data Protocols
Industrial data protocols such as OPC-UA, MQTT and Modbus are adapted so that data from different hardware can be collected on a common platform. Thus, data diversity becomes manageable.

Data Flow and Synchronization
Collected data is instantly visualized in the system and recorded with a time stamp. Data synchronization algorithms prevent data loss in case of connection interruptions.

Data Verification
Data coming into the system is checked for accuracy and consistency. Erroneous, incomplete or abnormal data entries are detected by the system and a warning is sent to the operator, and data quality is maintained.

Data Processing

Data Processing and Transformation

It enables the raw data collected from the production line to be cleaned, transformed and made analyzable. Thus, meaningful results are obtained from the data and contribution is made to decision support processes.

Features

  •  Data Cleansing
  •  Data Conversion
  •  Preprocessing and Filtering
  •  Data Compression and Storage

Data Cleaning
: Missing, contradictory or anomalous records in raw data are detected. Intelligent algorithms correct these data or remove them from the system, thus increasing the accuracy of the analysis.

Data Conversion
Device data coming in different formats and protocols are converted into a single standard structure for use in analysis. This step forms the basis for integration and comparative analysis.

Preprocessing and Filtering
Selects the necessary data for analysis and uses system resources efficiently. Duplicate or unimportant records are filtered to reduce data load and shorten processing time.

Data Compression and Storage
Compressing large data sets saves space in the database. This enables long-term archiving of historical data while improving system performance.

Production Monitoring

Production Parameters and Monitoring

It enables the definition and instant monitoring of parameters such as temperature, pressure and speed, which are critical in the production process. Thanks to continuous monitoring, production quality is increased and early intervention is provided in case of possible deviations.

Features

  •  Parameter Definition
  •  Determining Threshold Value
  •  Instant Monitoring
  •  Data Analysis and Reporting

Parameter Definition
Parameters such as temperature, humidity, pressure, equipment speed and energy consumption that need to be controlled during the production process are defined through the system. These parameters directly affect production quality.

Threshold Value Determination
Minimum and maximum limit values ​​are defined for each parameter. Thanks to these thresholds, deviations in production conditions are instantly detected and the system gives a warning.

Instant Monitoring
Parameters in the production line are monitored in real time from the system. With graphics, tables and indicator panels, operators and managers can easily monitor the instant status.

Data Analysis and Reporting
The collected data is analyzed on a time series basis to identify trends in production. Quality, efficiency and stability reports are created based on these analyses.

Anomaly Detection

Anomaly Detection and Alarm Management

It instantly detects abnormal situations occurring in the production line and minimizes the intervention time by sending timely notifications to the relevant personnel. In this way, quality losses and production interruptions can be prevented.

Features

  •  Anomaly Algorithms
  •  Instant Alarm Notification
  •  Failure and Stop Notifications
  •  Data Recording and Analysis

Anomaly Algorithms
Thanks to machine learning-supported algorithms, abnormal data behaviors in the production process are automatically detected. Unexpected deviations in parameters such as temperature, pressure or speed are marked by the system.

Instant Alarm Notification
When the defined threshold values ​​are exceeded, the system sends an instant alert to the relevant operators or administrators via e-mail, SMS or in-system notification. This speeds up the process of taking action.

Malfunction and Stop Notifications
Unplanned stoppages, malfunctions or production delays occurring in devices are detected instantly and recorded digitally. Notifications are directed to the relevant technical personnel for correct intervention.

Data Recording and Analysis
All anomaly and alarm events are stored in the system with a time stamp. Using this data, past problems are analyzed and preventive strategies are developed for similar events in the future.

Reporting

Reporting and Performance Analysis

It enables the data collected from the production line to be analyzed and converted into meaningful reports and the measurement of production performance. With visualization support, managers' decision-making processes are faster and more data-based.

Features

  •  Production Performance Reports
  •  Energy and Resource Usage Reporting
  •  Trend and Improvement Reports
  •  Data Visualization

Production Performance Reports
Detailed performance reports are created based on metrics such as productivity, capacity utilization and production cost by analyzing the amount of materials used in production, labor usage and device performance.

Energy and Resource Usage Reporting
Energy consumption, consumable usage and waste rates are analyzed to determine waste points. As a result of these analyses, cost reduction and sustainability strategies are developed.

Trend and Improvement Reports
Changes in production parameters over time are monitored to determine performance trends. In this way, areas for improvement in processes are identified and suggestions are presented.

Data Visualization
All reports created are presented in a user-friendly manner through graphs, tables and interactive dashboards. These visualizations facilitate quick access to information for decision-making processes.